Trial dimensions
Joost van Heerwaarden
Sample size
As for any experiment, deciding on appropriate sample size is important when designing tricot trials. Since determining differences in the performance of options is the aim of variety trials, the number of replicates per options (n) determines the statistical power. As can be seen in Figure 1, statistical power increases with n, and a quite substantial number of replicates may be required when differences between options are small, or residual (i.e. random) variation is large.
For example, detecting a difference in average (measured) yield equal to the residual standard deviation (i.e. a so-called Cohen’s d of 0.7 with 95% probability would require approximately 30 replicates per option. It is important to note that tricot ranking data contains less information than direct measurements and consequently, about twice as many replicates are needed to achieve equivalent power. Also, rank based estimates of option performance may be unreliable when n is too small and a minimum of 30 replicates should be aimed for.
Tricot trials are designed to be fully balanced, so once the number of replicates, n, and the number of options (noptions) is decided, it is straightforward to calculate the required resources. The following equations are helpful in this regard.
To calculate the number of plots required:
Nplots = nfarms × 3 = noptions × n
To calculate the number of farms required:
nfarms = (noptions × n)/3
To calculate the sample size, n, for an existing design:
n = (nfarms × 3)/ noptions
Interactive sample size calculator
This calculator assumes that the tricot format is being used (blocks of size 3). It is based on (Talsma, 2018).
It calculates how many samples are needed to achieve a certain Cohen’s d (effect size relative to the standard deviation of the technology options tested) with 95% probability. It does not take into account the data return rate. For a single season, a Cohen’s d of between 0.7 and 1.0 is reasonable. For a consumer preference test, a Cohen’s d between 0.2 and 0.5 is recommended.
link to sample size calculator
Interactive seed needs calculator
The calculator assumes that the tricot format is being used (blocks of size 3). The units of the “Seed quantity per plot” are the same as results (for example, kilograms but also number of plants can be used).
link to seed needs calculator
Locations
Tricot trials often cover different geographical or agroecological areas. In such cases, the most important aspects are sample size, balance, representation. As mentioned above, rank-based option performance estimates may be quite unreliable when n < 20. This also applies when differential performance across geographies needs to be estimated (Figure 2) so it is recommended to strive for at least 10-20 replicates per geographical area. For multiple environments, sequentially balanced data implies that pairs of options are compared the same number of times in each environment. This can be achieved by using a resolvable incomplete block (alpha) design, that can be generated by specialised software packages. In practice, the designs produced by ClimMob will be sequentially balanced if the same number of farms are assigned to different locations (Figure 3).
Finally, achieving good representation of geographical areas requires sampling multiple locations within the target region. A prototype sampling tool has been developed to aid in creating designs and itineraries for such multi-locational experiments (Figure 4). Logistically, it is convenient to sample multiple farmers per location and to allow detection of location specific effects it is recommended to have at least 10 replicates per location. In the example with 20 options and 7 locations shown in Figure 4. This would require visiting 467 farms in total (67 farms per location). An appropriate balance between coverage of target areas and logistical cost is important, which is why the sampling tool will calculate total travel time for the shortest routes between chosen locations.
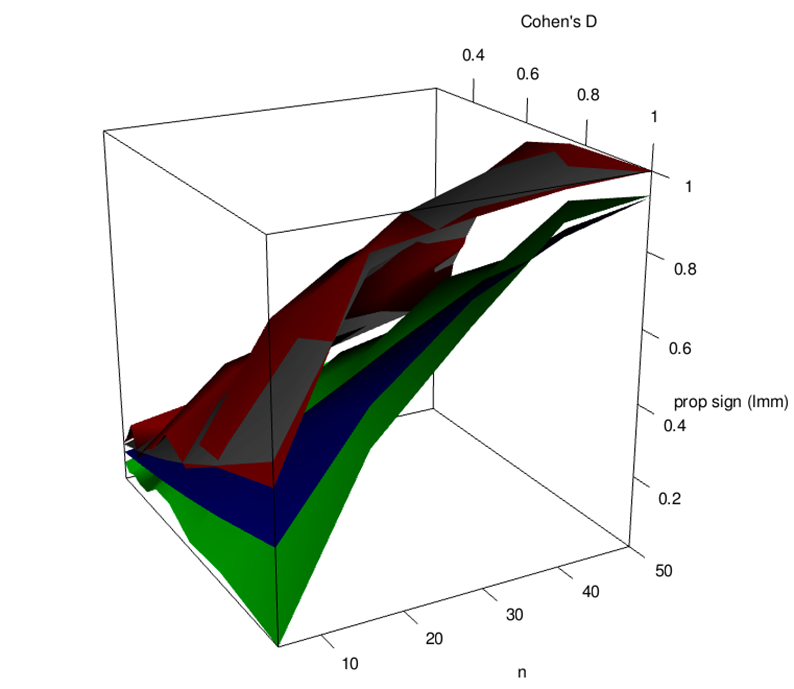
Figure 1. Simulated statistical power to detect a difference between two options (prop sign), as function of sample size (n) and magnitude of difference (Cohen’s D) for a quantitative trait (red) and for ranking data (red). The grey and blue planes indicate the expected values, assuming ranking data has an effective sample size of half compared to quantitative data.
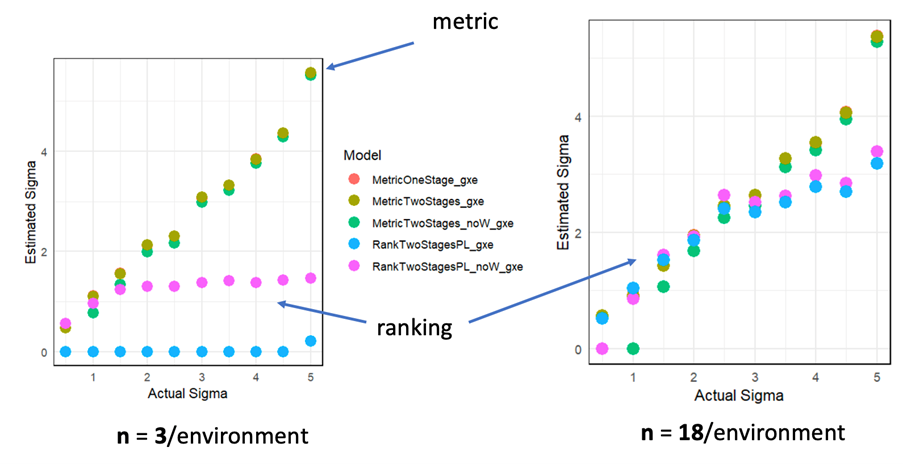
Figure 2. Simulated results demonstrating the effect of sample size on the ability to estimate variation due to option by environment interaction (sigma) using continuous (metric) and ranking data for 3 and 18 replicates per environment (10 environments).
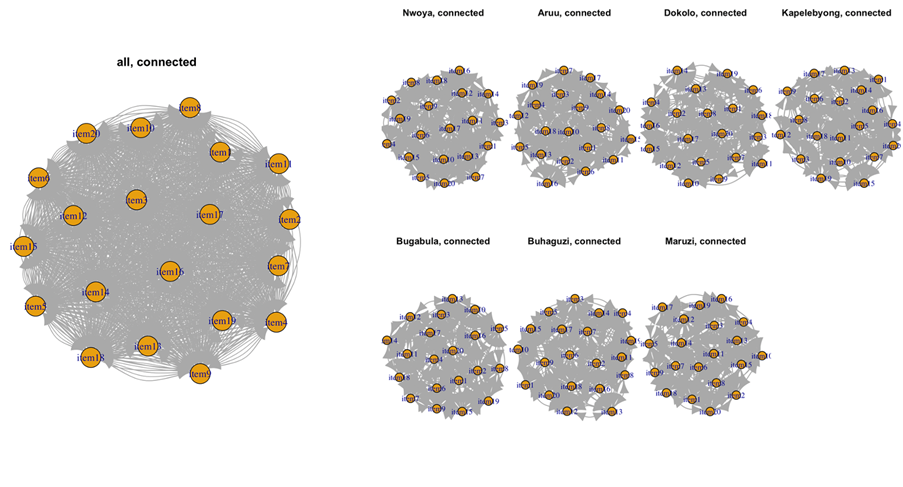
Figure 3. Network graphs showing connectivity and balance in pairwise comparisons for aggregated (left) and disaggregated (right) multi-location data.
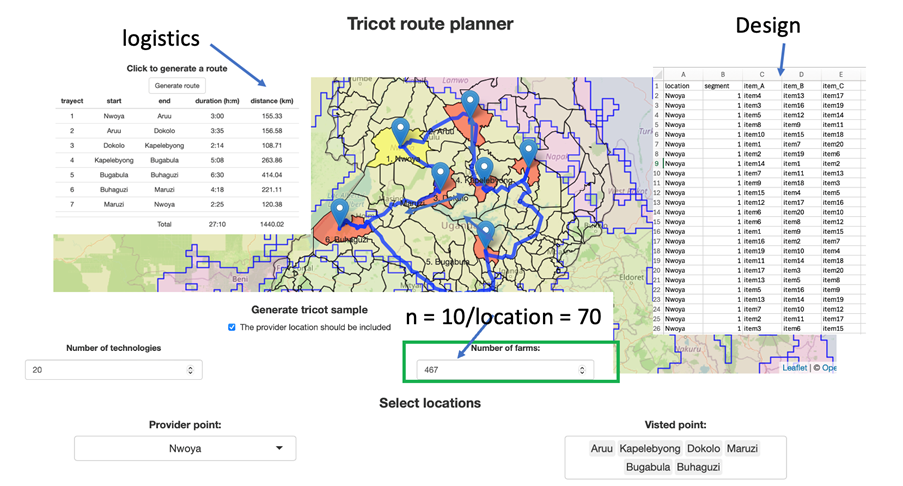
Figure 4. Overview of output of the sampling tool prototype showing the most efficient route among locations covering a an agro-ecological zone.
A recurrent issue is deciding about plot size and the number of plots (replications). In the literature about crop trials, there are several methods to guide decision making. At the same time, this is not just a question of statistics, but also biological considerations are important. For tricot trials, there are a number of additional considerations related to farmers’ capacities.
Plot size
Plot sizes should generally be small, for the following reasons.
- With the same amount of seeds, more farmers can participate. Tricot is about external validity, so capturing the diversity in use contexts is important.
- Small plots sizes allow farmers with small farms to participate. This makes tricot trials more inclusive and representative.
- Small plot sizes increase the variation between farms, but do not systematically bias results upwards or downwards (unless edge/border effects play a strong role, see below).
Tricot plots should not be too small, however.
- Strong edge or border effects should be avoided. This can be avoided by not harvesting border rows.
- If varieties are also tested for processing or culinary characteristics, plots should produce sufficient volume to allow this.
Some remarks on specific crops:
- For potato, competition effects between plots consisting of single ridges seems unimportant for yield, as stolons rarely extend beyond ridges (Connolly et al., 1993).
- For cassava, interplot competition effects have been found to extend beyond the first row (Elias et al., 2018).
- For sweetpotato, interplot interaction is thought to be substantial due to above-ground competition (Grüneberg et al., 2019). For sweetpotato trials, 30 m2 plots with 100 vine cuttings have been recommended for on-farm trials (Grüneberg et al., 2019)). For a tricot trial in Ghana, however, much smaller 6 m2 plots with 20 vine cuttings were used, which is two thirds of the recommended plot size of on-station trials.
Plot size is closely related to the number of seeds that is provided to farmers. In grain crops, breeders often provide seeds based on the average weight needed for a unit of land. However, this can be problematic when there are seed size differences between varieties. A small-seeded variety would be represented by more seeds. Consequently, the farmer may decide to increase the plant density of a small-seeded variety or add more planting positions. This could bias yield estimates to favour small-seeded varieties. It is therefore recommendable not to provide the same weight of seed for each variety, but the same number of seeds.
Number of plots (or farms)
For a trial with around 12 entries (varieties, lines, etc.) typically 100-200 farms would provide solid results to make recommendations. This means that the trial has a 95% probability of identifying differences (effect sizes) between 0.7 and 1 standard deviations (Cohen’s d). Since trials are done over several seasons, this number will diminish over time. See the interactive sample size calculator below to estimate the number of farms needed.
This is the same order of magnitude that was found in previous on-farm trial work with cereals.
If the trial covers more agro-ecological environments (to which the set of varieties is expected to respond in different ways), the number of farmers should be proportionally higher. Future studies should provide better guidance regarding optimal trial dimensions.